3rd
Showing 409–420 of 1172 resultsSorted by latest
-
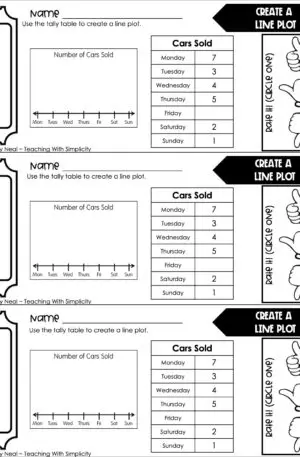
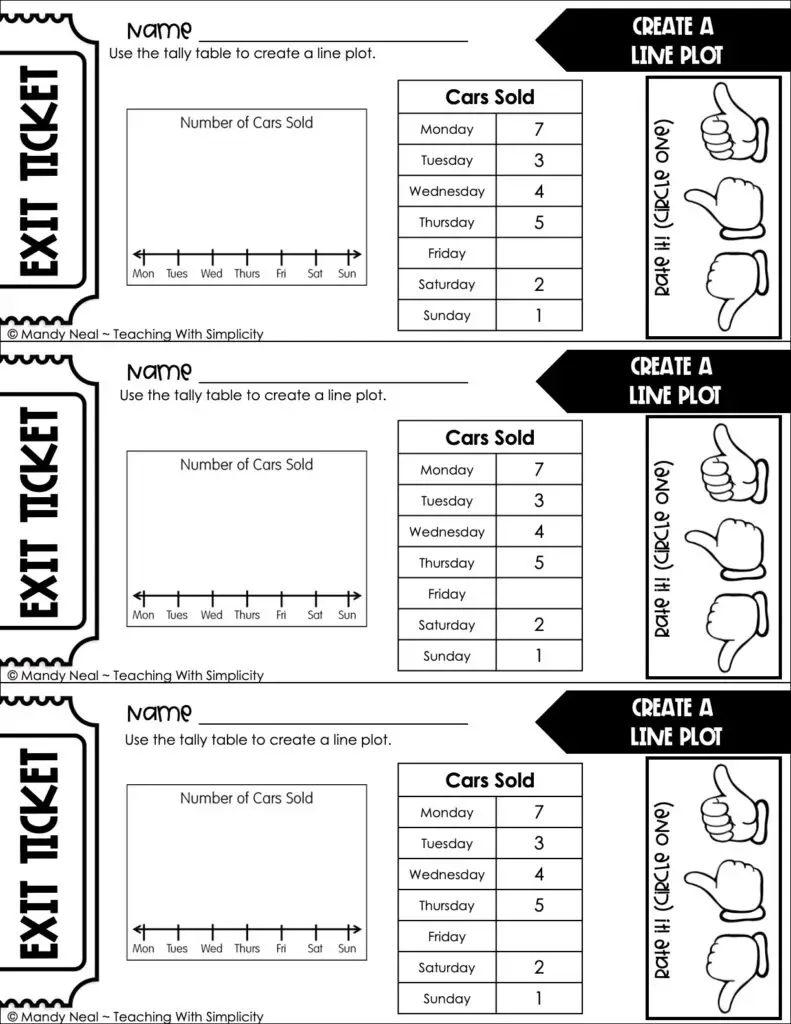
3rd Grade Represent and Interpret Data – Create a Line Plot Exit Ticket 1
ViewQuick View -
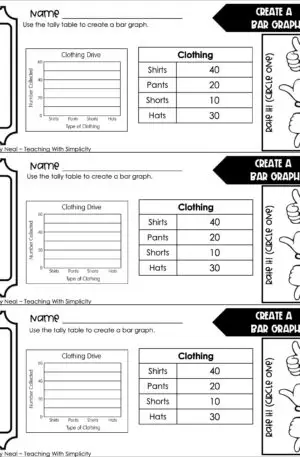
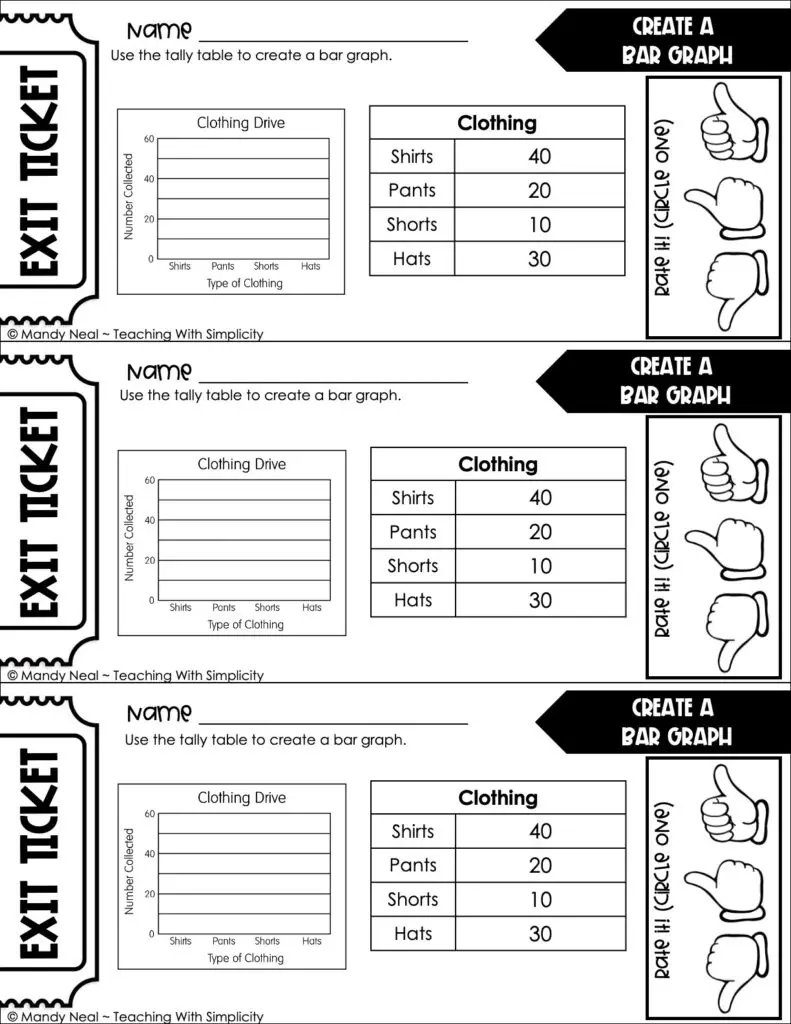
3rd Grade Represent and Interpret Data – Create a Bar Graph Exit Ticket 2
ViewQuick View -
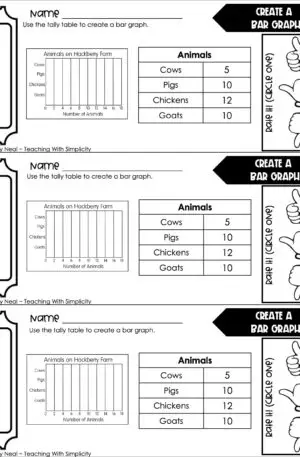
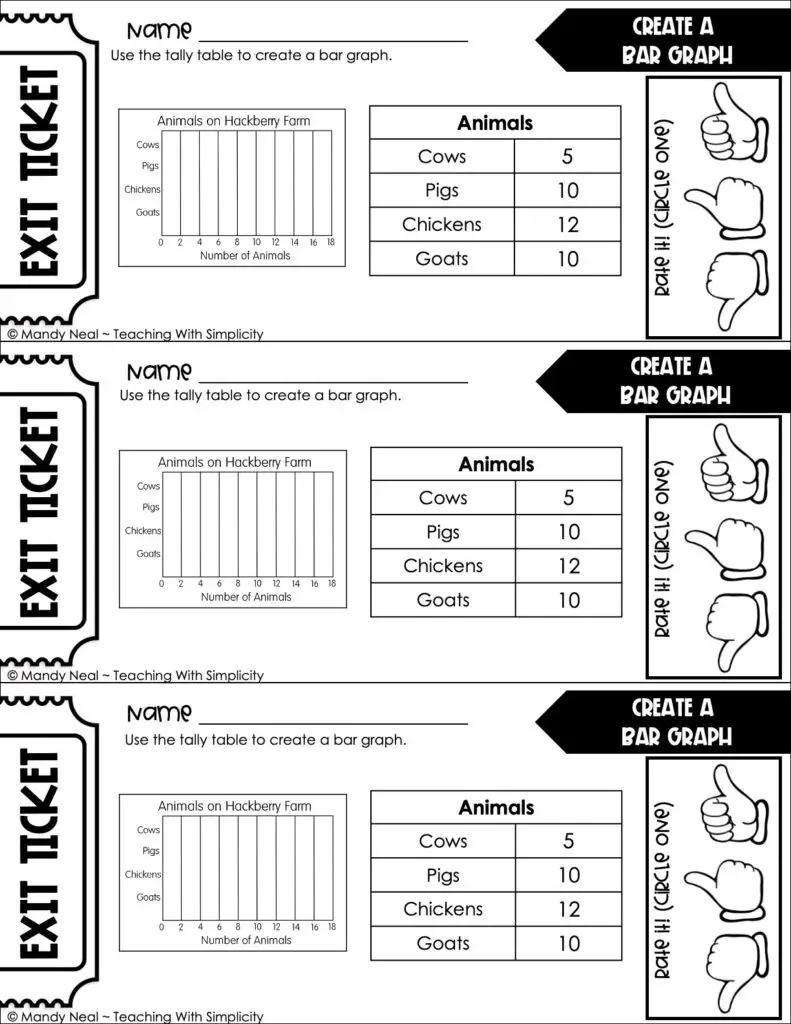
3rd Grade Represent and Interpret Data – Create a Bar Graph Exit Ticket 1
ViewQuick View -
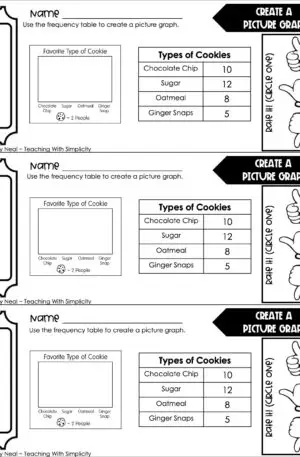
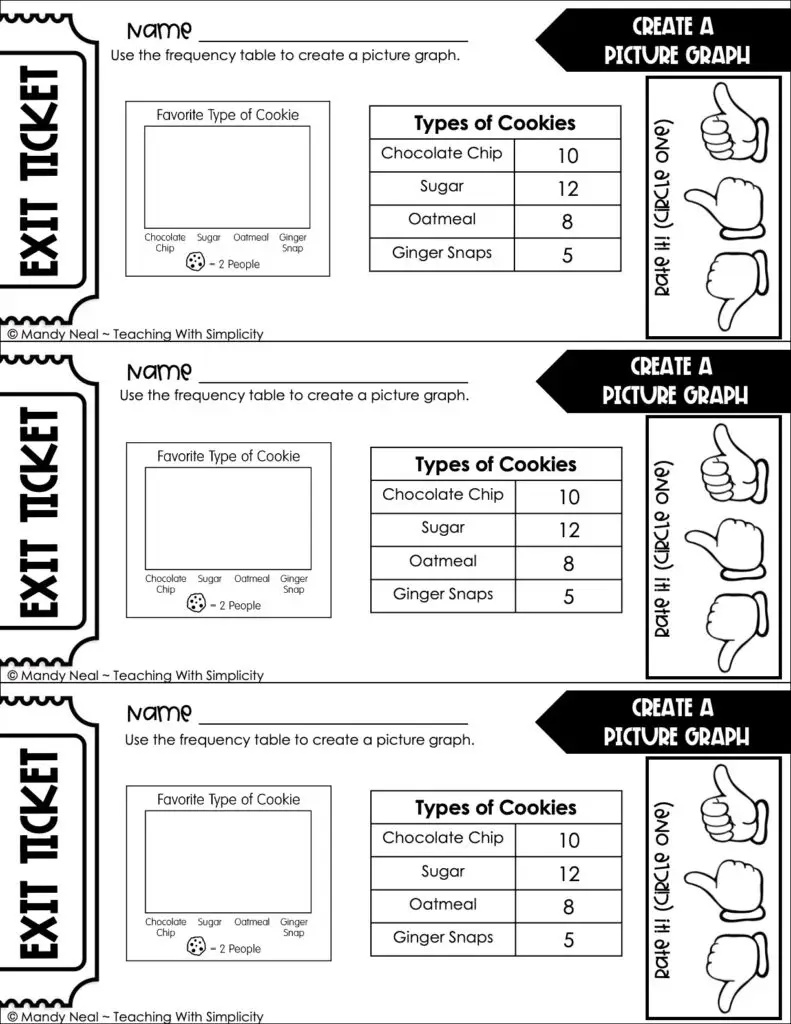
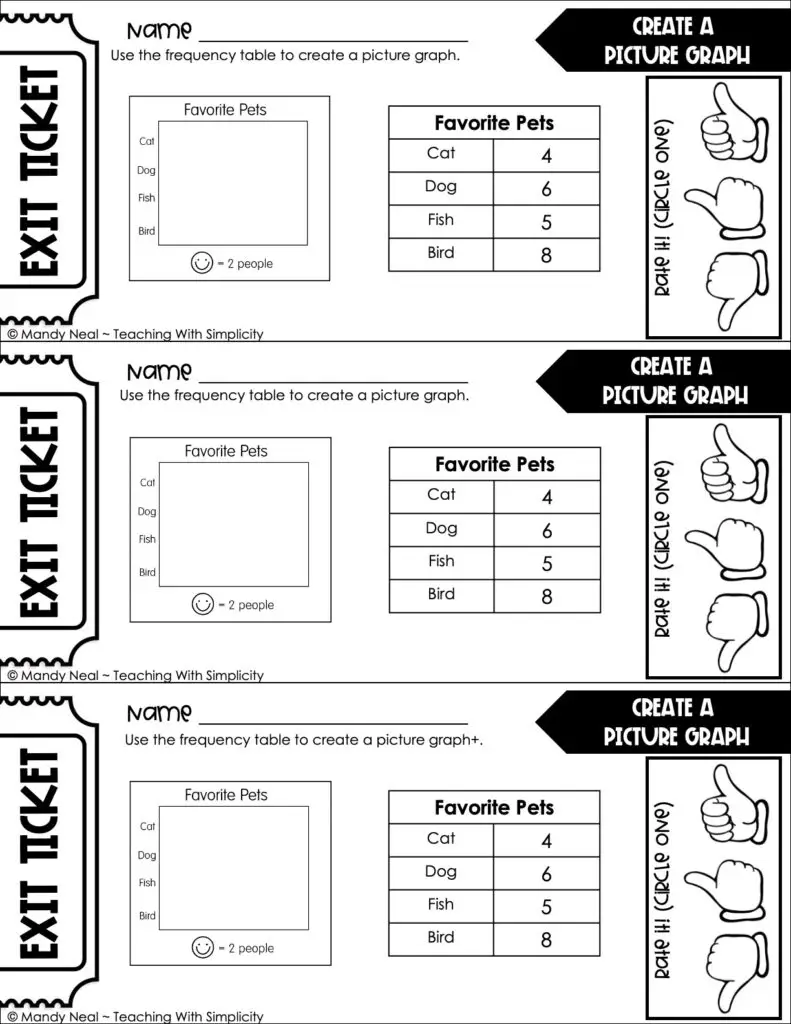
3rd Grade Represent and Interpret Data – Create a Picture Graph Exit Ticket 2
ViewQuick View -
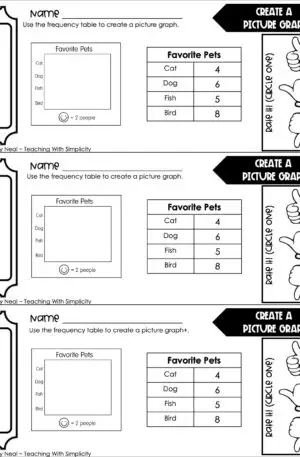
3rd Grade Represent and Interpret Data – Create a Picture Graph Exit Ticket 1
ViewQuick View -
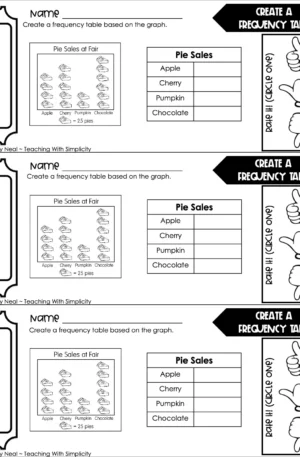
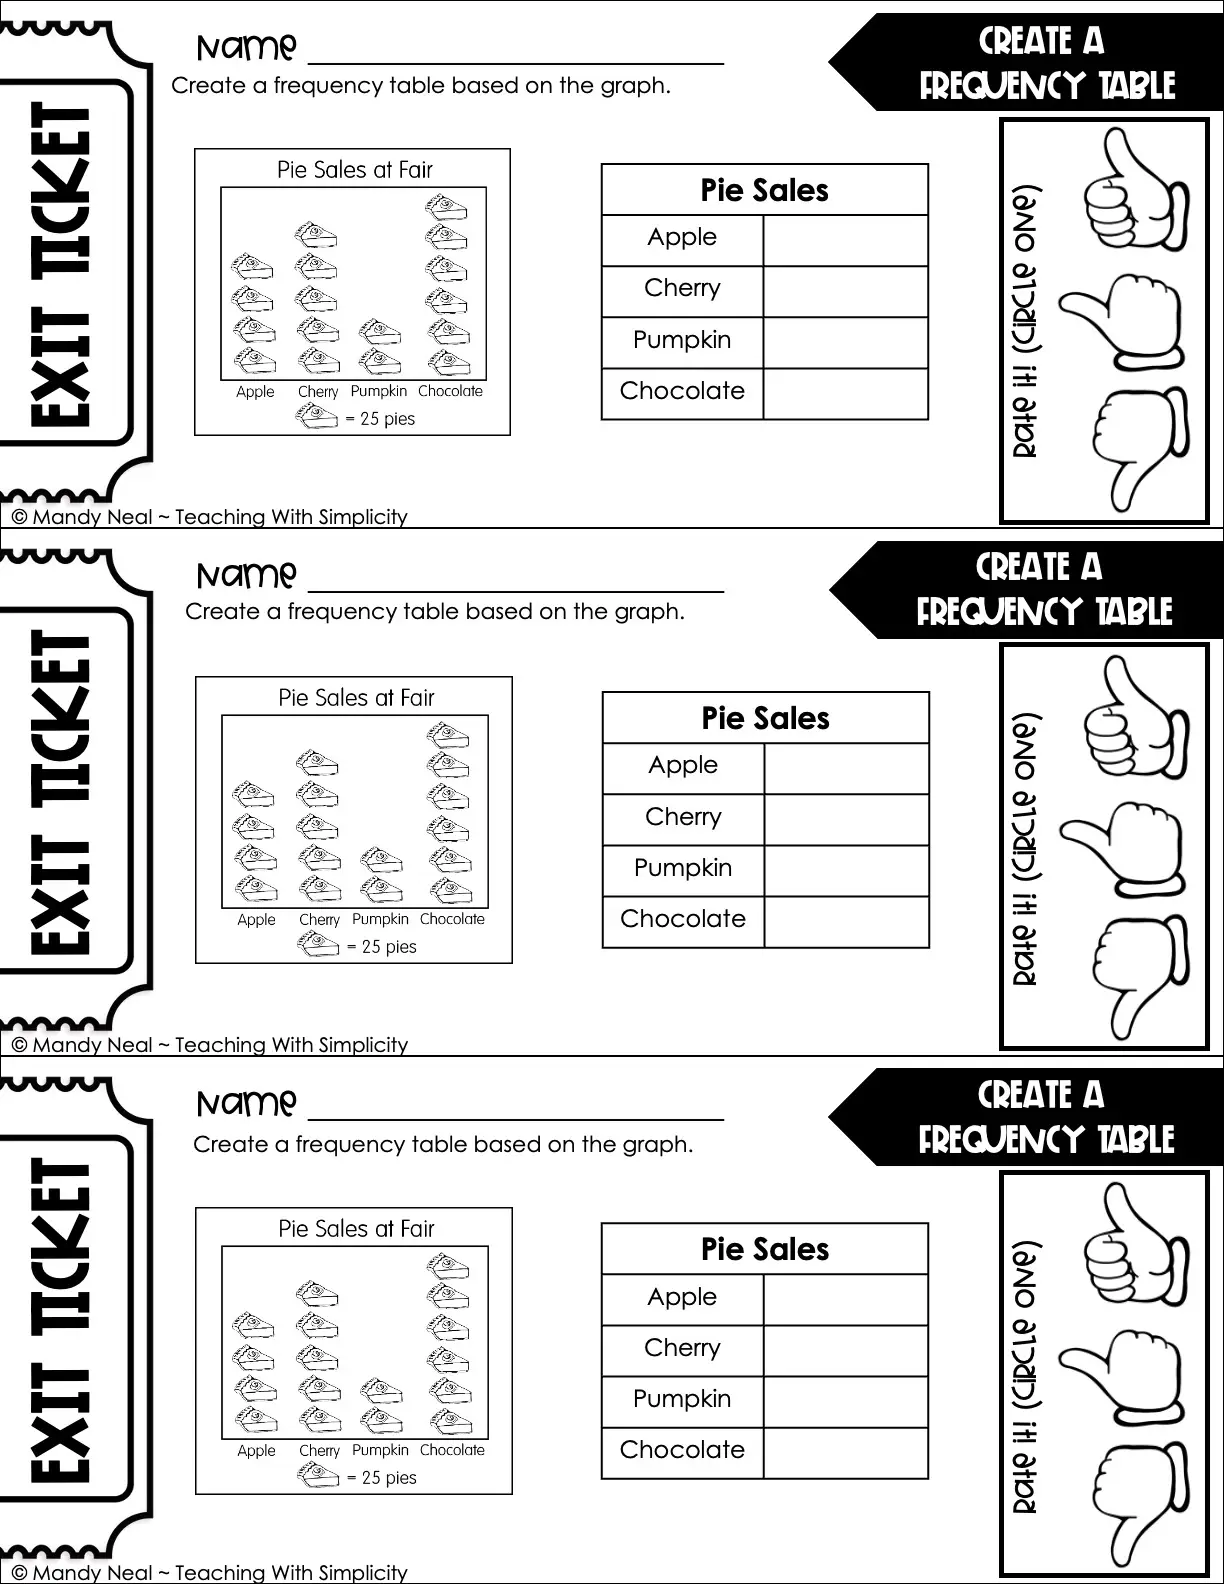
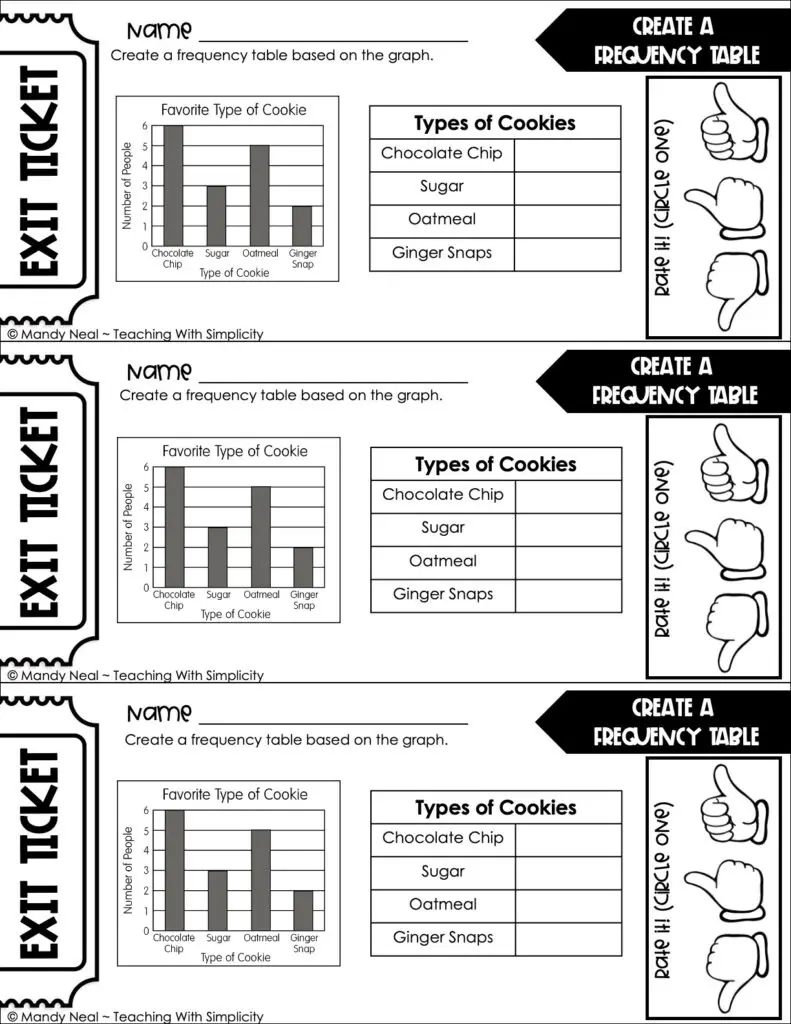
3rd Grade Represent and Interpret Data – Create a Frequency Table Exit Ticket 2
ViewQuick View -
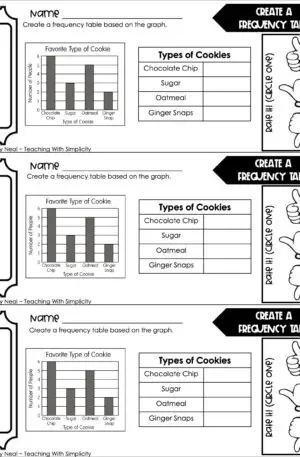
3rd Grade Represent and Interpret Data – Create a Frequency Table Exit Ticket 1
ViewQuick View -
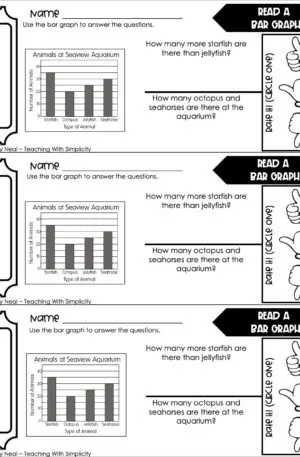
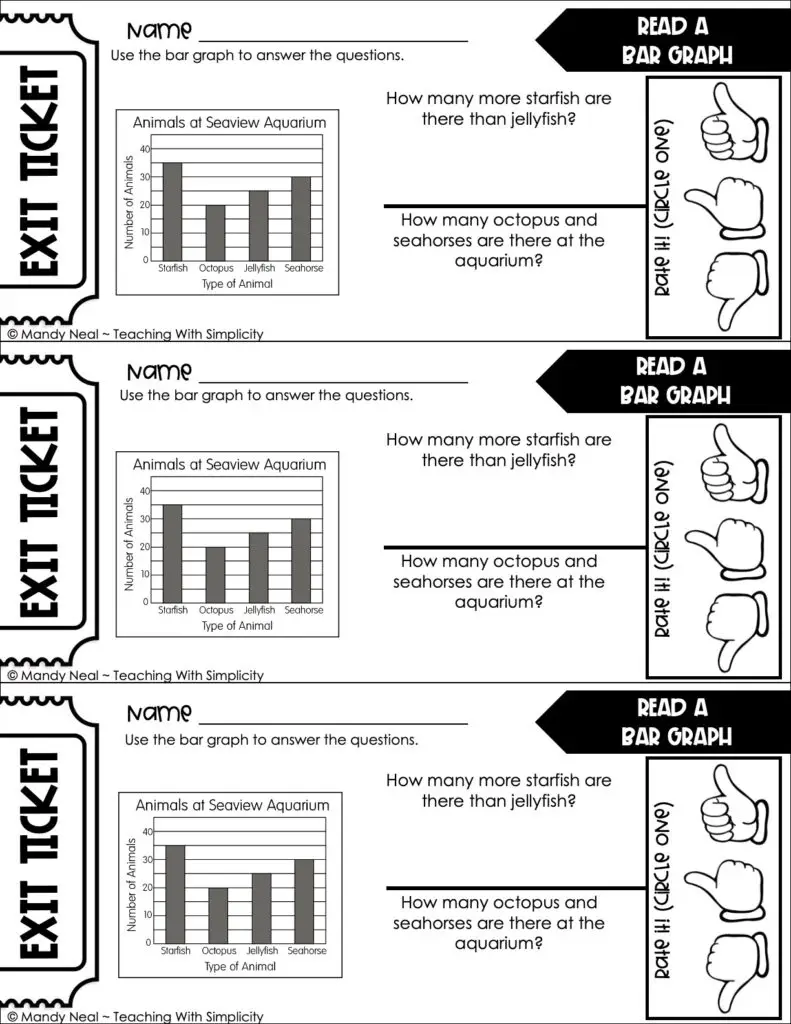
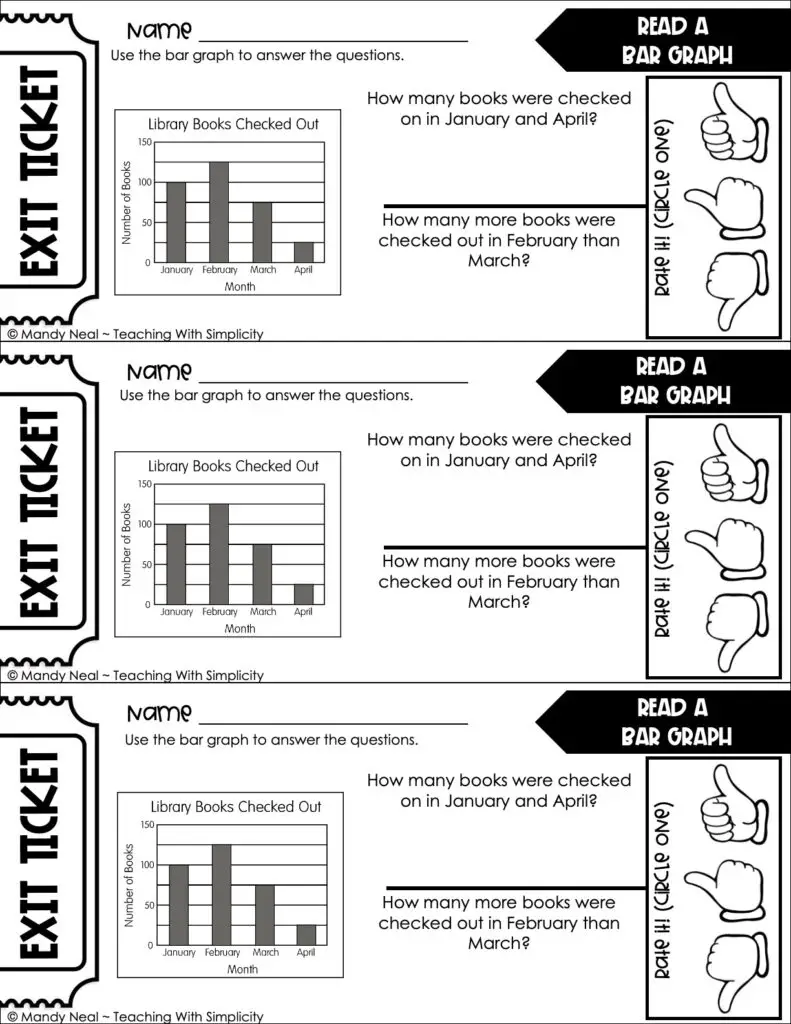
3rd Grade Represent and Interpret Data – Read a Bar Graph Exit Ticket 2
ViewQuick View -
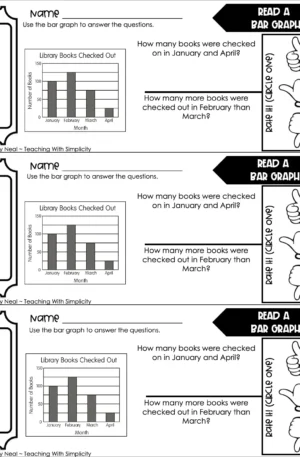
3rd Grade Represent and Interpret Data – Read a Bar Graph Exit Ticket 1
ViewQuick View -
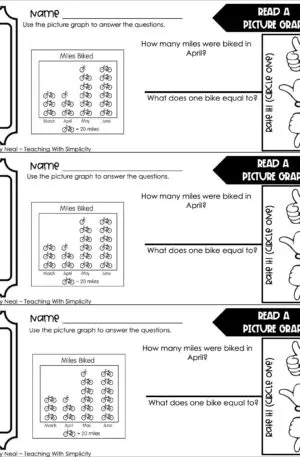
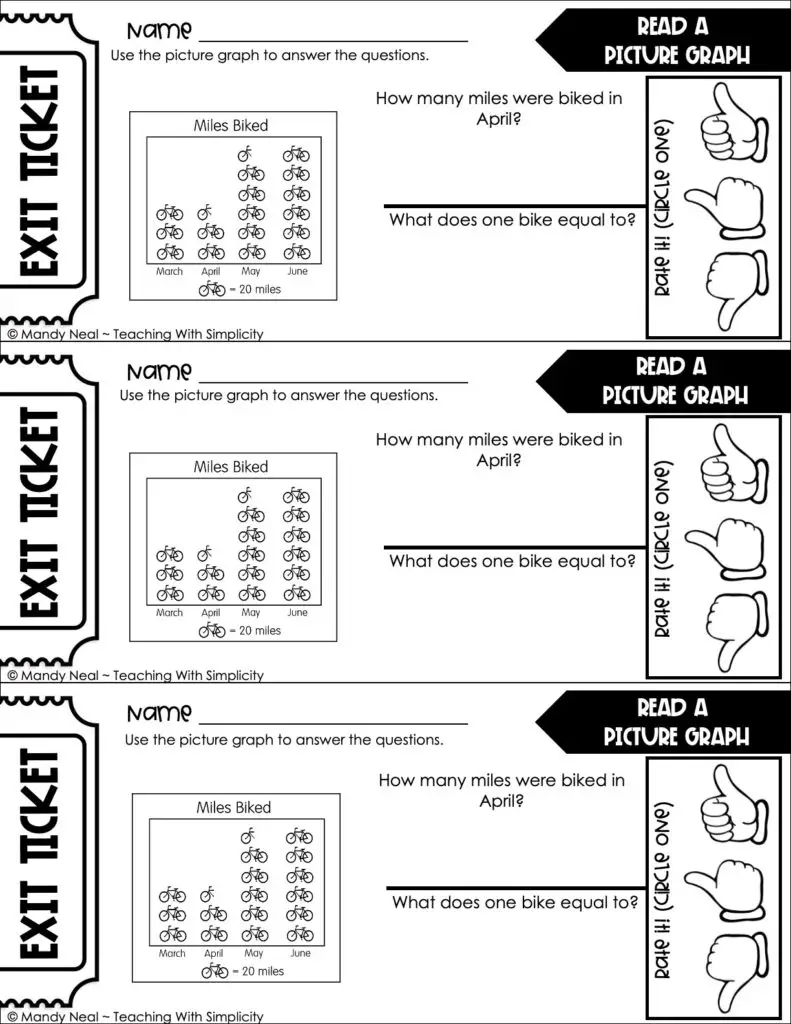
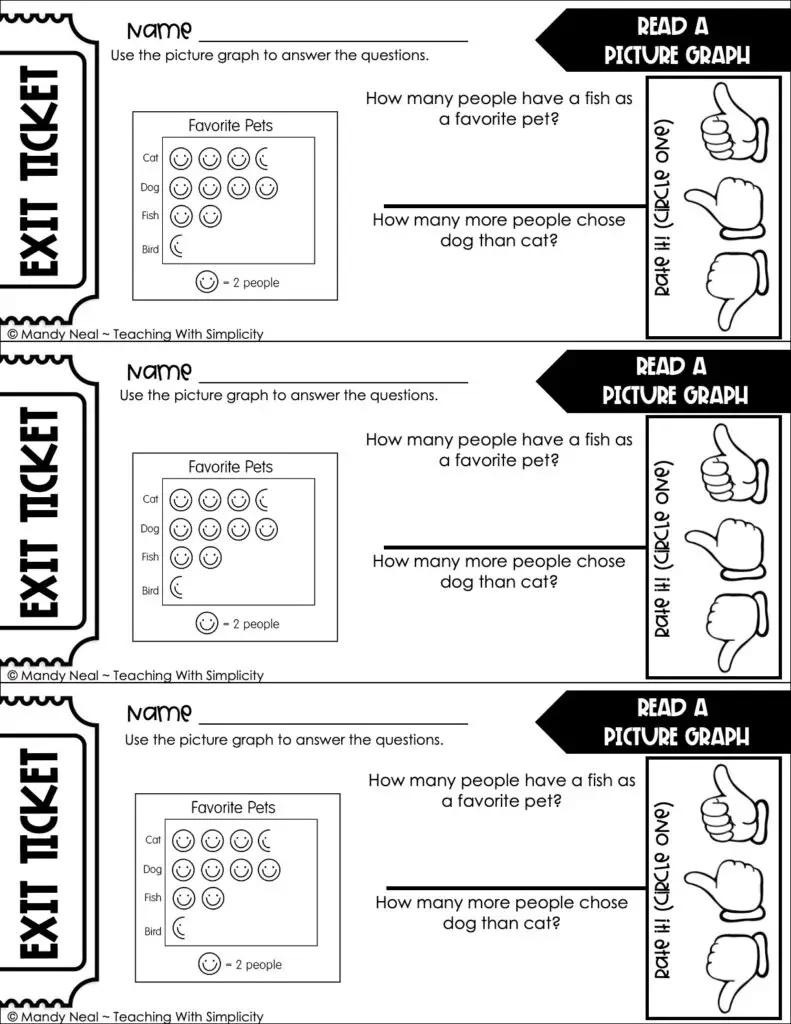
3rd Grade Represent and Interpret Data – Read a Picture Graph Exit Ticket 2
ViewQuick View -
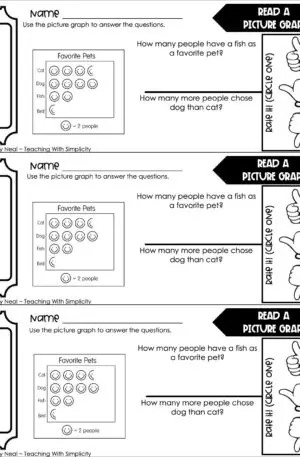
3rd Grade Represent and Interpret Data – Read a Picture Graph Exit Ticket 1
ViewQuick View -
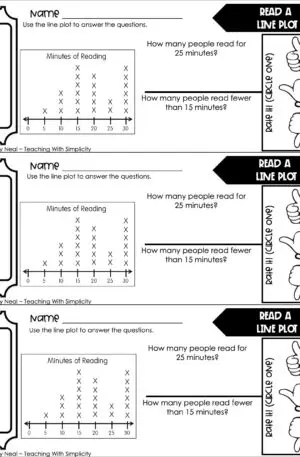
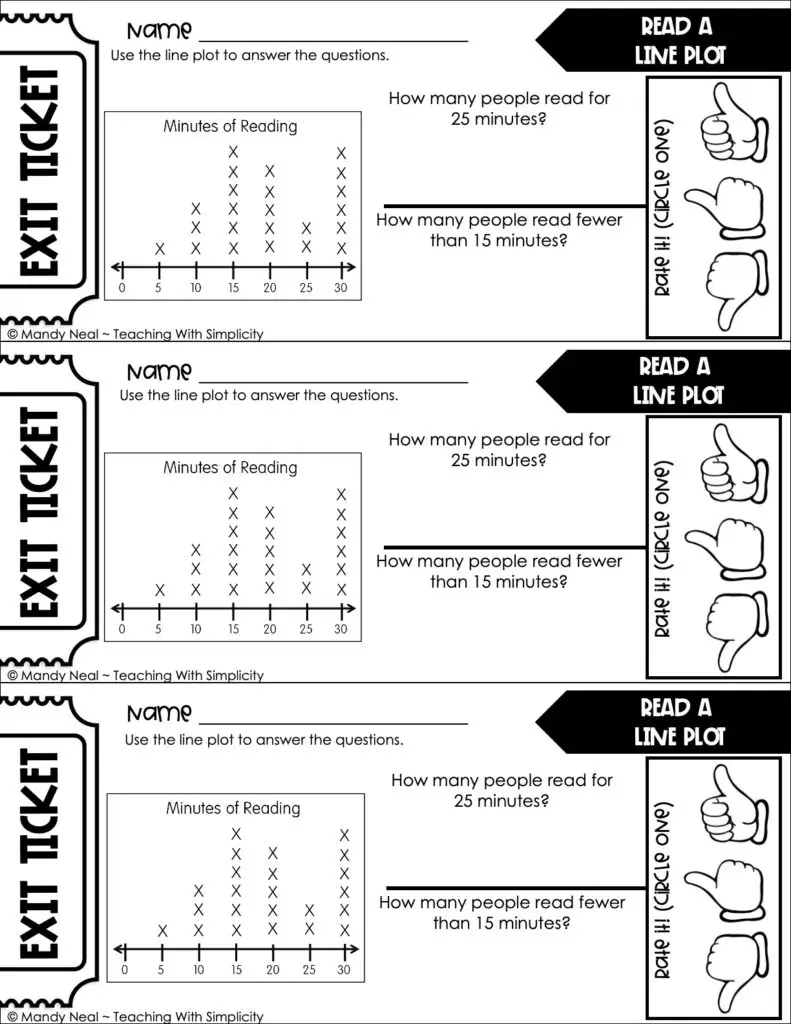
3rd Grade Represent and Interpret Data – Read a Line Plot Exit Ticket 2
ViewQuick View


